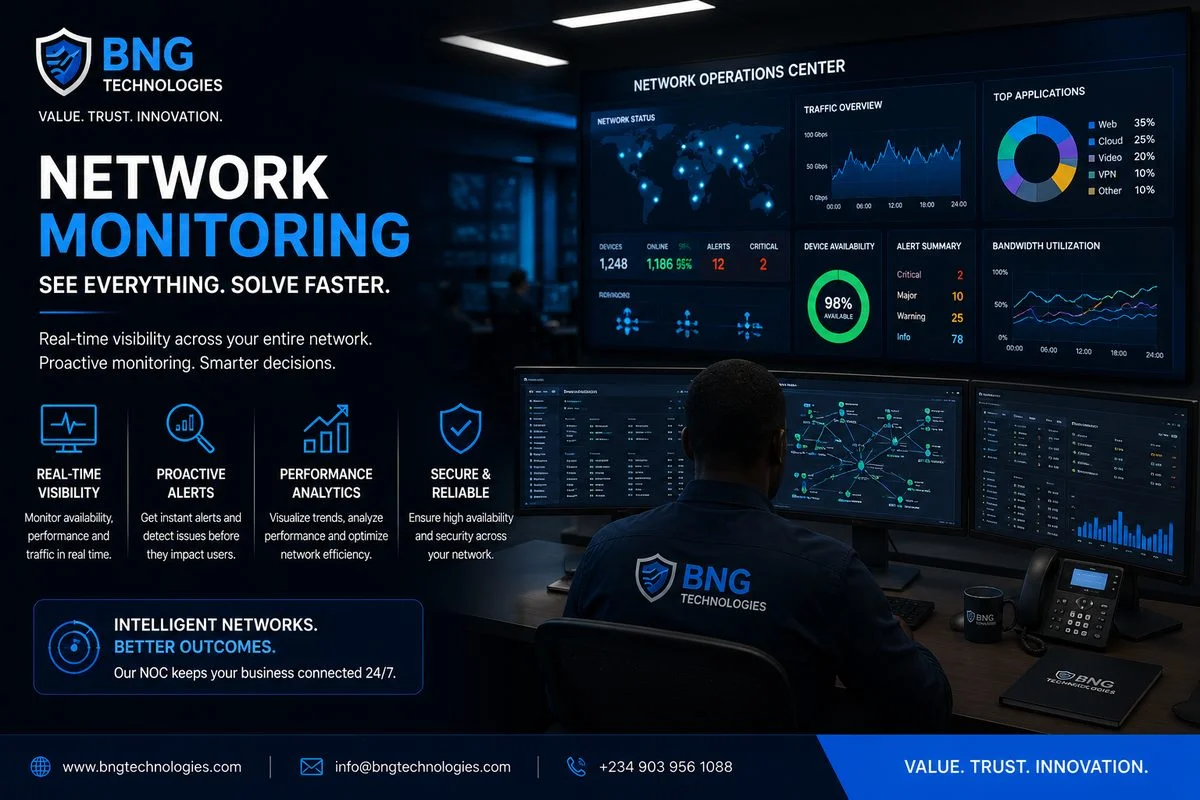
For most enterprise IT teams, network monitoring still works the same way it did fifteen years ago: something breaks, an alert fires, an engineer responds. The process is reactive by design — you find out about a problem only after users are already affected.
This approach has two costs that rarely show up on a technology budget but are very real: the direct cost of downtime (lost productivity, missed transactions, SLA penalties), and the reputational cost of users experiencing degraded service before IT even knows there is a problem.
In 2025, modern network observability platforms have made predictive monitoring genuinely accessible — even for mid-sized African enterprises. This article explains what that shift looks like in practice, and what it means for your NOC and IT operations teams.
The Difference Between Monitoring and Observability
These terms are often used interchangeably, but they describe fundamentally different things.
Monitoring is about tracking predefined metrics — CPU utilisation, interface bandwidth, ping response times. You know in advance what you want to watch. When a metric crosses a threshold, you get an alert. This is the traditional approach — and it works for problems you anticipate.
Observability is about understanding system behaviour well enough to diagnose problems you did not predict. An observable system collects rich telemetry — metrics, logs, flow data, device state — and makes that data queryable in real time. When something goes wrong that you have never seen before, you can still answer the question: "What happened, and why?"
The practical difference: A monitoring tool tells you that a core switch's CPU hit 95%. An observability platform tells you which specific traffic flow caused the spike, which application generated it, which user initiated it, and whether this pattern has occurred before.
What Predictive Monitoring Actually Looks Like
The term "predictive" gets used loosely, so it is worth being precise about what modern platforms actually do.
Baseline Learning and Anomaly Detection
Modern monitoring platforms learn what "normal" looks like for your network — time of day, day of week, traffic patterns between specific segments, device behaviour. Once a baseline is established, deviations trigger alerts before they become outages. A WAN link that normally runs at 40% utilisation spiking to 85% at 3am is flagged for investigation — not after it saturates, but while there is still time to act.
Predictive Capacity Alerts
By analysing historical utilisation trends, modern platforms can project when a link, a storage volume, or a compute resource will reach capacity — and alert you weeks in advance. This turns capacity planning from a reactive scramble into a scheduled activity. For Nigerian enterprises dealing with expensive international bandwidth or limited data centre space, this is directly valuable.
Root Cause Correlation
When multiple alerts fire simultaneously — which happens in any significant network event — legacy tools flood the NOC with hundreds of notifications. Modern observability platforms correlate those alerts to identify the root cause: one failed WAN link causing cascading alerts across fifty dependent systems. Engineers see one event, not fifty.
AI-Assisted Diagnosis
Several platforms now incorporate AI-assisted diagnostics that analyse telemetry data and suggest likely causes. This is particularly valuable for African IT teams where senior network engineers are in short supply — it closes the skills gap between what your team knows and what the data is telling you.
The African Enterprise Context
Several characteristics of Nigerian and West African network environments make modern observability particularly compelling.
WAN Link Reliability and Cost
International bandwidth is expensive in Nigeria. A saturated or degraded WAN link has immediate, measurable business impact. Predictive capacity management and early degradation detection — catching a circuit that is intermittently dropping packets before it becomes a full outage — has direct financial value that is easy to quantify.
Multi-Site Complexity
Nigerian enterprises — especially in banking, telecoms, and oil and gas — operate across dozens or hundreds of locations. Manual monitoring of that estate is not feasible. Modern platforms provide a single-pane view of the entire estate, with automated alerting and drill-down capability from the enterprise level to an individual port on a branch switch.
Power and Infrastructure Variability
Generator switchovers, UPS events, and power fluctuations create network events that are often invisible to traditional monitoring but are clearly visible in device logs and environmental telemetry. Modern observability platforms can correlate power events with network performance degradation — making it possible to understand and address the root cause rather than just the symptom.
From a recent engagement: A client with 80 branch locations was receiving hundreds of daily alerts from their legacy NMS — most of them false positives or low-priority notifications. After migrating to a modern observability platform with AI-based correlation, alert volume dropped by over 90%, and two genuine pre-failure events were caught and resolved before users were affected. The NOC team went from alert fatigue to proactive management.
Key Capabilities to Evaluate
When assessing network monitoring platforms, these are the capabilities that separate modern observability solutions from legacy NMS tools:
What to look for
- Full-stack visibility — network, server, application, and cloud in a single platform
- NetFlow / IPFIX support — for traffic analysis and application visibility, not just interface statistics
- Automated topology discovery — the platform builds its own map of your network without manual configuration
- AI-based baselining and anomaly detection — alerts based on deviation from normal, not fixed thresholds
- Root cause correlation — groups related alerts into a single event with a probable cause
- API integration — connects to your ITSM, SIEM, and ticketing systems
- Cloud and hybrid support — monitors AWS, Azure, and on-premise environments in the same console
Leading Platforms in This Space
The network monitoring market has matured significantly. These are the platforms most commonly deployed in enterprise environments:
- SolarWinds NPM / Orion — widely deployed, strong for on-premise environments; familiar to most Nigerian IT teams
- Cisco ThousandEyes — best-in-class for internet and cloud path visibility; excellent for multi-site WAN monitoring
- Fortinet FortiMonitor — strong integration with Fortinet security fabric; good choice if your environment is Fortinet-centric
- Datadog — cloud-native platform with strong full-stack observability; increasingly used in hybrid environments
- PRTG Network Monitor — accessible for mid-market organisations; strong value at lower price points
- Zabbix — open-source option with strong community support; viable for cost-sensitive deployments with in-house engineering capability
Making the Business Case
IT leadership in Nigerian enterprises often faces budget pressure when proposing monitoring upgrades. The business case is straightforward but needs to be framed in financial terms, not technical ones.
Calculate the cost of your last significant network outage: hours of downtime multiplied by the number of users affected, plus any direct revenue impact (failed transactions, missed SLAs, emergency vendor callouts). Then estimate how many of your incidents in the past twelve months could have been prevented with predictive alerting. That number — the cost of avoidable incidents — is your business case.
For most enterprises, a single prevented major outage pays for a year of modern monitoring. The second prevented outage is pure ROI.
The Bottom Line
Reactive monitoring is not a strategy — it is a posture of permanent firefighting. For Nigerian enterprises operating complex, multi-site networks in challenging infrastructure environments, the move to predictive observability is not a luxury. It is what separates IT teams that manage their networks from IT teams that are managed by them.
BNG Technologies designs, deploys, and manages network monitoring and observability platforms for enterprises across Nigeria and West Africa. If your current monitoring is generating more noise than insight, our team can help.
Ready to move from reactive to predictive?
Our network engineers can assess your current monitoring posture and recommend a platform that fits your environment and budget.